
Beyond the Dashboard | Principle 3: Choose What to Measure
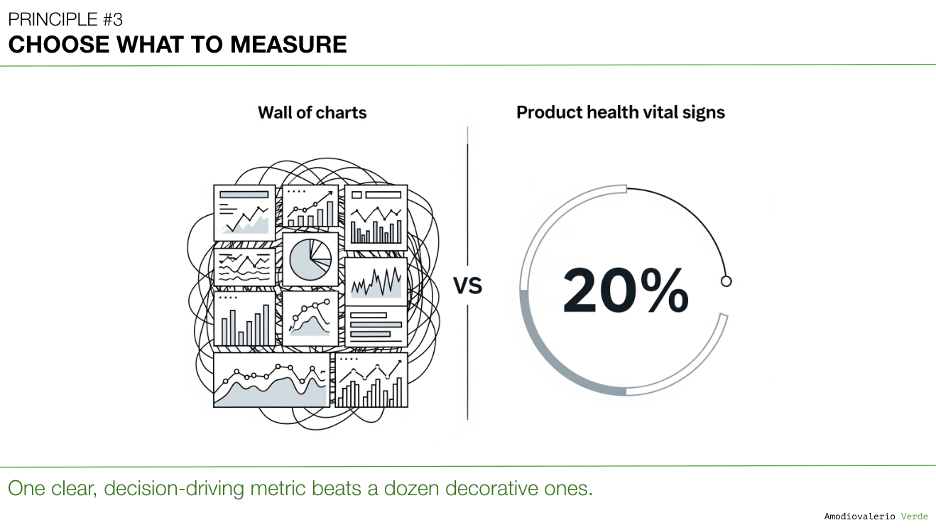
Think like a doctor, not a data collector. Your dashboards should be a cockpit, not a buffet. Every metric has a cost in attention, fueling debate and cognitive load. Track only what informs decisions. If a number doesn't drive action, it's just noise.


TL;DR (for teams still adding metrics like it’s a hobby):
- Every metric has a cost. Not money, but something worse: attention. Metrics consume focus, fuel debate, and create cognitive load.
- Track only what informs decisions. Interesting numbers don’t drive action. Vanity metrics waste leadership energy.
- AI will scale whatever signals you feed it. Garbage in? Smarter-looking garbage out. Choose signals that matter.
- Think cockpit, not buffet. Dashboards should steer, not decorate. Track fewer, sharper, decision-driving metrics.
- Use the 6-question checklist before adding any metric. Every number must earn its place.
This is Principle 3 of the Beyond the Dashboard series.
In Principles 1 and 2, we saw how data obsession creates the illusion of progress, and why data-informed teams lead with judgment, not dashboards.
Now, we tackle the core execution failure: measuring too much, without thinking. Because every metric you track shapes what your team and your AI optimizes for.
Choose wrong, and your AI will scale the wrong outcome at machine speed.
The Problem: Too Many Metrics, Too Little Thought
Your dashboards are lying to you. Not because of missing data, but because of too much of it. And not because your strategy demands it. But because someone, somewhere, thought tracking "time spent in app per session per persona per browser version per region" was insightful.
Measuring feels like progress. Dashboards sparkle. People nod in meetings. But most of those numbers? Just expensive noise.
Each new number is another dashboard guest you’re now hosting, feeding, and justifying. A metric without purpose isn't neutral. It’s harmful.
Most companies choose the buffet. They grab every number "just in case."
Result? Your team tracks everything… and decides nothing.
Yes, "track fewer metrics" isn’t new advice. But this is not about less. It’s about choosing sharper, smarter, and strategic.
The Cost of Cheap Metrics
We measure what’s easy, not what’s useful.
Logins. Clicks. Session length. Metrics that feel actionable but aren’t.
If a metric doesn’t drive a decision, it’s not insight but only a distraction.
These distractions:
- Waste attention.
- Create the illusion of action.
- Fuel prioritization theater.
In short, vanity metrics are the official sponsors of the “This Meeting Could Have Been an Email” Foundation.
Why AI Scales Your Choices. Good or Bad
Now, enter AI. Our new assistant. Our favorite excuse. And sometimes, our latest problem.
AI amplifies whatever you feed it. Right signals? AI scales insight. Wrong signals? AI optimizes noise. Fast.
AI is not your strategy. It’s your amplifier. Choose carefully.
With the right signals:
- AI flags anomalies humans miss.
- AI summarizes patterns faster than analysts.
- AI automates reporting so humans can focus on decisions.
But AI can’t decide what matters. That’s your job.
Think Like a Doctor. Focus on Vitals
Doctors don’t track everything your body does. They focus on heart rate, blood pressure, temperature. Core vitals.
Your product needs the same:
- Decision-driving metrics.
- Predictive signals.
- Numbers that steer decisions.
Everything else? Diagnostics. Temporary, situational, and disposable.
Too many signals aren’t helpful. They’re noise.
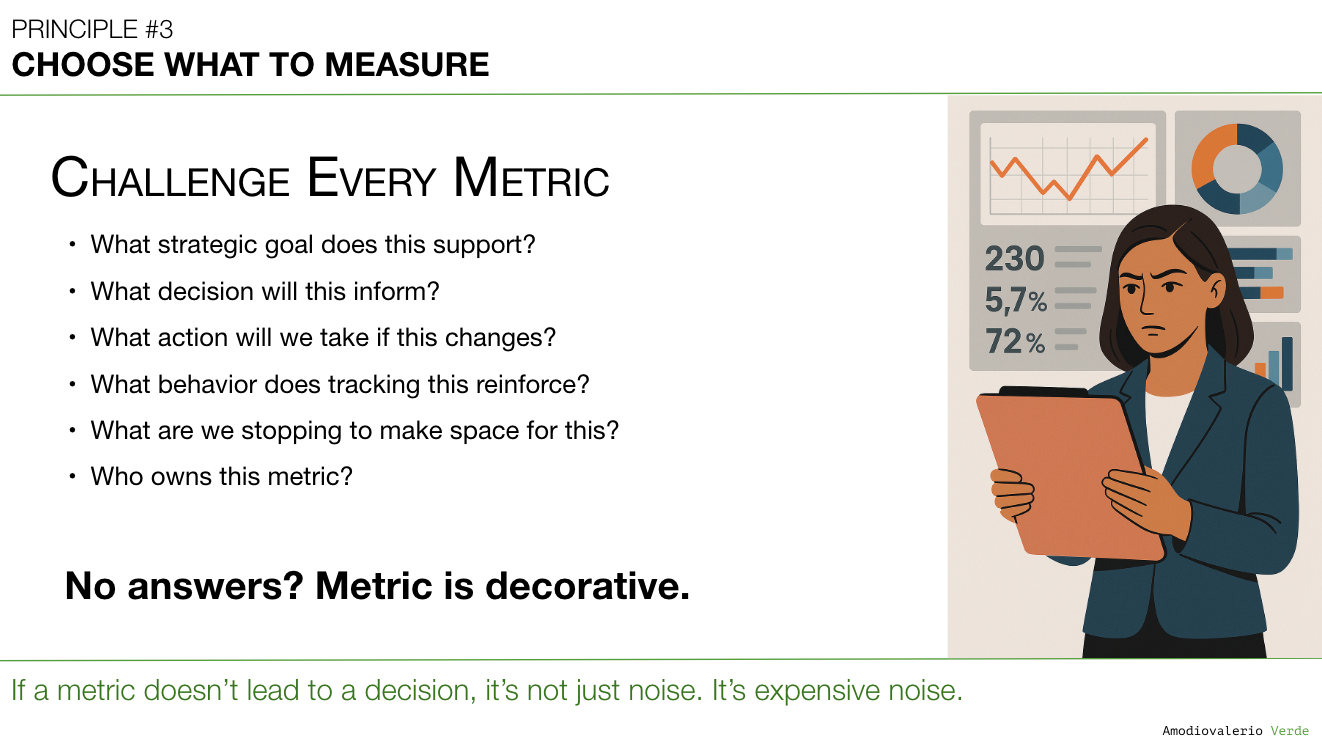
The Metrics Gatekeeper
Every metric you track signals to your team: “This matters.”
Dashboards are not passive. They shape behavior. Leaders must act as Gatekeepers and ruthlessly deciding what gets tracked.
Before adding a metric, force this conversation:
- What strategic goal does this support? If unclear, it doesn’t belong.
- What decision will this inform? No decision? Remove.
- What action will we take if this changes? If the answer is "nothing," stop tracking.
- What behavior does tracking this reinforce? Metrics shape incentives. Careful what you count.
- What are we stopping to make space for this? Adding without subtracting is building a landfill.
- Who owns this metric? No owner? No accountability. No point.
If a metric can’t answer these questions, it doesn’t belong. And no: “Because the dashboard needs it” is not a strategy.
Dashboards aren’t reports. They’re steering wheels.
The Crisis Test: Why Clean Metrics Matter Under Pressure
Good measurement systems are invisible when things are calm and essential when they’re not.
Here’s the test:
If your dashboards disappeared tomorrow, could your teams still make good product decisions for a week? Could they prioritize, triage, and steer without asking for another report?
If the answer is no, your organization isn’t data-informed. You’re data-dependent.
Teams addicted to bloated dashboards freeze when signals disappear. Teams with clear, decision-driving metrics keep moving.
In a crisis, dashboards don’t save you. Judgment does. And disciplined measurement is what sharpens that judgment.
Clean, purpose-driven metrics aren’t just good strategy hygiene. They’re operational resilience
From Strategic Intent to Metric
To avoid vanity metrics:
- Start with intent.
- Define the signal.
- Track only what informs action.
Dashboards don’t exist to display data. They exist to help you decide.
Choose decision-driving over vanity. Every time.
Why Cutting Metrics Is Hard
Metrics don’t just inform decisions. They shape behavior. And in the AI era, wrong behavior scales fast.
Removing bad metrics isn’t just a strategy task – it’s a political act. Teams fear missing data. Leaders fear removing safety nets. You’ll meet resistance.
But ignoring the problem doesn’t make it go away. Wrong metrics quietly rewire your strategy while nobody’s watching.
Exploratory Metrics: A Discipline, Not a Free-for-All
Exploration isn’t chaos. But too often, teams confuse investigative metrics with decision-driving ones.
Keep your primary dashboard stable and sparse. Treat exploratory metrics as temporary, investigation-only tools. Use them with discipline, then discard.
Here’s the structure:
Level 0: The Strategic Vital Sign
The single, stable metric that signals the problem. Example: Monthly Churn Rate. You don’t act directly on it. It tells you when to investigate.
Level 1: The Diagnostic Layer
Track the metric most connected to your hypothesis. Example: Adoption Rate of the ‘Aha!’ Feature. If adoption is high but churn is also high, your hypothesis is wrong. If adoption is low, you have an execution problem. One diagnostic metric. Not five.
Level 2: The Investigation-Only Layer
Temporary, granular metrics. Example: Funnel Drop-off Rate by Step. Time-on-Step. Click-through Rates. These metrics exist only to solve a known problem. Once solved? Remove them.
This layered approach gives you rigor without clutter. Focused dashboards for steering. Deep exploration when needed. Clear separation between the two.
Important Clarification: This does not mean your product teams should avoid broad analytics tracking. Tracking feature adoption, task completion rates, and behavioral flows across your product suite remains essential for understanding usage and identifying UX pain points. But leadership dashboards and AI decision systems must remain sharp and curated.
Not every tracked metric deserves a place in your strategic steering layer.
In short: Track wide for learning. Filter hard for deciding. Broad exploration feeds insight but decisions demand focus.
Stop Treating Every Metric as Permanent
Most “new critical metrics” aren’t critical. They’re situational. Investigative. Temporary.
Before adding anything, ask:
- Is this a decision-driving metric?
- What strategic goal does it serve?
- What will we stop tracking to make space?
- And most importantly: is this metric permanent or temporary?
Dashboards need stability to avoid cognitive fatigue. Adding every new metric permanently is operational laziness disguised as thoroughness.
The Dashboard Disappearance Test
Ask your leadership team: “If our dashboards disappeared tomorrow, would we still know how to decide?”
If the room goes quiet, your problem isn’t missing data. It’s missing clarity.
Final Thought
Metrics aren’t just numbers. They are organizational signals. They shape behavior. And behavior shapes outcomes.
In the AI era, every signal you track becomes a lever you’re pulling – intentionally or not.
Choose carefully.
AI won’t fix bad decisions. It will scale them. Faster.
What’s Next?
Even good metrics mislead when frameworks are misused.
Which leads to: Principle 4: Use Frameworks as Filters, Not Blueprints
Because AARRR, HEART, OKRs, and NSMs are tools. They sharpen thinking. They don’t replace it.
See you in Principle 4.
PAQs – Potentially Asked Questions
Why is “tracking everything” dangerous in the AI era, when data is abundant and cheap?
Because abundance isn't free. Every metric shapes attention, fuels debate, and nudges behavior. In AI-powered teams, the danger is compounded: irrelevant signals get amplified at machine speed. Without human judgment defining what matters, AI optimizes the wrong outcomes, faster. The problem isn’t storage but focus.
Can’t exploratory metrics help uncover unknown insights? Why restrict them?
Exploration is essential. But exploratory metrics should live in isolated, time-bound investigations and not in executive dashboards or decision systems. Otherwise, temporary data points become permanent noise. Leaders must separate discovery signals from decision signals, or risk diluting focus and strategy.
How does AI change leadership’s role in metrics governance?
AI shifts leaders from being consumers of metrics to curators of signals. Leadership’s role isn’t asking for “more reports.” It’s defining which signals matter and why, because AI will scale whatever the system tracks. In short: Leaders must now design the information system, not just read it.
When should a metric be retired? Isn’t data retention harmless?
Retiring metrics is as important as adding them. Each metric consumes team focus and implies importance. Retained irrelevant metrics signal false priorities and create decision inertia. The question isn't “Can we track it?” but “What happens if we stop tracking it?” If the answer is “Nothing,” it’s noise.
How do you handle stakeholder pushback when trying to cut metrics?
Expect resistance. Metrics become safety blankets for teams and leaders afraid of missing signals. Reframe removal as focus optimization, not data loss. Explain that retiring a metric is an act of strategic clarity, not operational risk. If a metric lacks ownership or decision consequence, it’s harming and not helping the organization.
Aren’t AI models themselves just driven by data? Why prioritize metrics when the model can optimize?
Models don’t optimize outcomes, they optimize what they’re trained and directed to optimize. If you feed models irrelevant signals, they’ll optimize irrelevant outcomes. Human judgment must define the problem space. AI then accelerates within those boundaries. Leaders set the frame. AI scales it.
What’s the single most important question to ask before adding a metric?
“What decision will this metric drive?” If no clear, actionable answer exists, reject the metric. Metrics without decisions aren’t insights, they’re liabilities.
Each principle in this series builds upon the last to form a coherent system for better decision-making. Here is the full list of principles we are exploring:
Intro: Beyond the Dashboard Series
Principle 1: Avoid the Data Delusion
Principle 2: Adopt a Data-Informed Approach
Principle 3: Choose What to Measure
Principle 4: Use Frameworks as Filters, Not Blueprints
Principle 5: Focus on Adoption, Not Just Delivery
Principle 6: Know Your Tool Stack’s Boundaries
Principle 7: Build Layered Dashboards to Scale Thinking
Principle 8: Manage Multi-Product Portfolios Separately
Principle 9: Reconcile Metric Definitions Before Analysis
Principle 10: Build Thinking Systems, Not Reporting Systems
Principle 11: Turn AI into a Judgment Multiplier