
Beyond the Dashboard | Principle 10: Build Thinking Systems, Not Reporting Systems
Most teams have great dashboards that report the past, not systems that drive decisions. A thinking system starts with a clear question, ties metrics to actions, supports diagnosis, and treats AI as a partner for speed, not a substitute for judgment. Goal: better decisions, not prettier charts.


TL;DR (for those who know their dashboards are just well-designed wallpaper)
- Most companies have built excellent reporting systems that show what happened. They have failed to build thinking systems that help decide what to do next.
- A reporting system tells the story. A thinking system helps write the next chapter.
- We don't need more charts; we need reasoning structures that connect data directly to action and decisions.
- A true thinking system starts with a clear question, ties every metric to a potential action, and supports diagnosis when things change. If a metric changing leads to no action, it is decorative.
- AI can be a powerful partner in a thinking system, but only if it's used to accelerate diagnosis, not to outsource judgment. Dashboards aren't the ultimate goal; better decisions are.
A Quick Recap: The Common Language
In Principle 9: Reconcile Metric Definitions Before Analysis, we addressed the most expensive habit in modern business: arguing about what numbers mean because the definitions were never clear. We established that a Metric Dictionary is the foundational operating system for clarity, ensuring that when we discuss a metric like "Monthly Active Users," everyone is speaking the same language.
But once you have that common language, a new challenge emerges. You have clean, well-defined, universally understood metrics displayed on polished dashboards. The charts are accurate. The numbers are up-to-date. And yet, you ask the most critical question of all: "What are we doing differently because of this?"
And the answer is often met with silence.
This silence reveals a deep, systemic failure. We have become masters of reporting on the past, but amateurs at shaping the future. This brings us to the critical transition from passive observation to active reasoning.
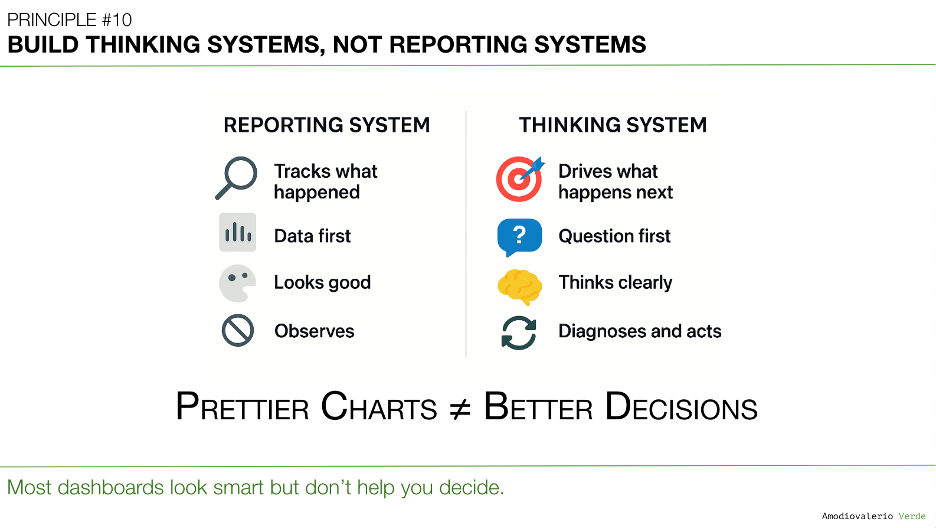
The Difference Between Reporting and Thinking
Most companies have invested millions in building world-class reporting systems. These systems are brilliant at capturing and displaying what has already occurred. They are history books, meticulously detailing the events of the last quarter, the last sprint, or the last hour.
But a history book, no matter how accurate, won't tell you what to write on the next page.
That’s the job of a thinking system.
- A reporting system shows you the number.
- A thinking system helps you decide what to do about the number.
This isn't a subtle distinction; it is the Grand Canyon that separates teams that are busy from teams that create impact. We don't need more charts. We need more reasoning structures that connect data to decisions.
The Qualities of a True Thinking System
If your dashboards feel like they are being posted into a void, shared in Slack and then ignored, it’s because they are artifacts of a reporting system. They are designed to inform, not to provoke action. A thinking system, by contrast, is designed with a different purpose. It operates on a few core principles:
1. It Starts with a Clear Question, Not a Pile of Data
A thinking system doesn’t begin by pulling every available metric in the hope that an insight will magically appear. It starts by framing a specific, high-stakes question: "Should we continue to invest in this feature?" or "Why is our new user activation rate stalling?" The data is then gathered with the explicit purpose of answering that question.
2. Every Metric Is Tied to an Action
In a thinking system, no metric gets a free pass. Before a chart is added to a dashboard, the team must be able to answer: "If this number goes up, what will we do? If it goes down, what will we do?" If the answer to both is "nothing," then the metric is purely decorative and serves only to create noise.
While the principle that every metric must be tied to an action is a powerful weapon against clutter and vanity metrics, applying it with absolute rigidity can be counterproductive. This ideal overlooks the crucial role of other types of metrics.
For instance, guardrail metrics, like system uptime or error rates, are valuable precisely because they don't change much; the action is "do nothing" unless a critical threshold is crossed. Similarly, high-level contextual metrics, such as total market share, provide essential strategic context for leadership. They inform a wide range of decisions indirectly, even if they don't trigger a single, pre-defined action when they fluctuate. The key is to distinguish between a metric that is truly 'decorative' and one that provides vital, even if passive, situational awareness.
3. It Is Designed to Support Diagnosis
When a metric changes, a reporting system simply alerts you to the fact. A thinking system is designed to help you understand why. It connects high-level outcomes (the "telescope" view from Principle 7) to the underlying drivers (the "levers"), allowing teams to investigate, not just observe.
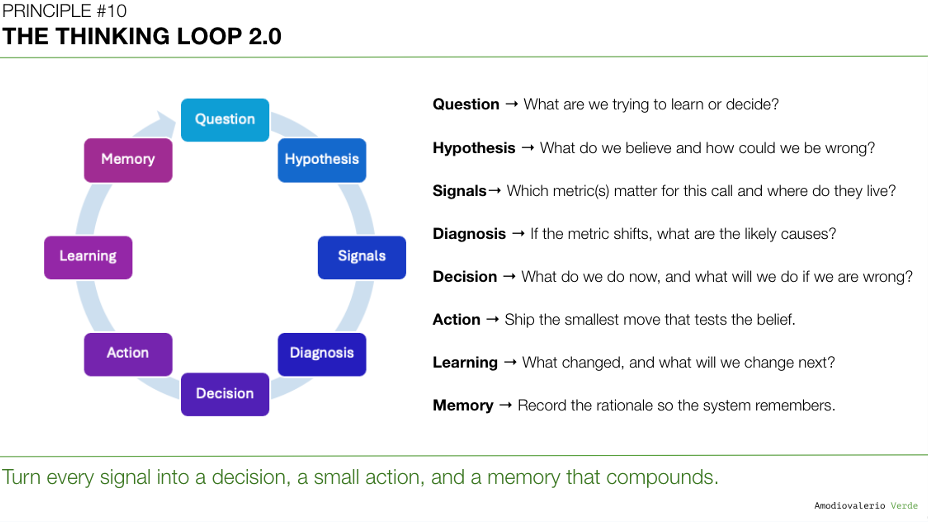
The Thinking Loop 2.0
Upgrade the loop your teams run every cycle:
- Question → What are we trying to learn or decide?
- Hypothesis → What do we believe and how could we be wrong?
- Signals→ Which metric(s) matter for this call and where do they live?
- Diagnosis → If the metric shifts, what are the likely causes?
- Decision → What do we do now, and what will we do if we are wrong?
- Action → Ship the smallest move that tests the belief.
- Learning → What changed, and what will we change next?
- Memory → Record the rationale so the system remembers.
This loop sits on the foundations already discussed:
- Metric Dictionary from Principle 9. Shared meaning. Fewer debates.
- Layered dashboards from Principle 7. Telescope for outcomes, levers for teams, microscope for analysts.
- Tool boundaries from Principle 6. Specialists, not oracles. Federated clarity beats forced consolidation.
Architecture of a Thinking System
Keep it lightweight, explicit, and observable.
Inputs
- Layered views with one outcome metric per exec context, 3-5 drivers per team, deep dives for analysts.
- A reconciled metric dictionary with name, source, formula, owner.
Reasoning scaffolds
- A Hypothesis Card per bet: belief, risk, decisive signal, decision rule, counterfactual test.
- An Assumption Map: what must be true, how we will falsify it, who owns the probe.
- A Decision Tree for common incidents: if X rises and Y falls, then do Z, else investigate A/B/C.
Decision rituals
- Cycle Decision Review: 30 minutes to close the loop on last cycle’s hypotheses and open new ones.
- Recurring Product Health: per-product review before any roll-up. No Franken-metrics.
- Feature Kill Rate on the exec scorecard. Reward stopping what does not work.
Memory
- A Decision Log that stores the question, options, chosen path, expected signal, and result. This protects you from “brilliant mind leaves, system forgets.” Reward leaving traces.
AI: Your Partner in Diagnosis, Not Your Replacement for Judgment
This is where Artificial Intelligence can become a powerful partner, but only if it is plugged into a system that is already designed for thinking.
Mindlessly asking an AI to "find insights" in your data is an abdication of thought. It will find patterns, but it won't understand your context, your strategy, or your customers. It will simply produce faster, more confident-sounding noise.
However, when used within a thinking system, AI becomes a tireless junior analyst that can accelerate diagnosis at an incredible scale. You can use it to:
- Surface anomalies in driver metrics that correlate with a change in a top-line outcome.
- Cluster qualitative feedback from user interviews or support tickets to add context to a quantitative drop.
- Simulate the potential impact of different actions before you commit resources.
The key is to keep humans in the decision loop while automating parts of the discovery loop. AI’s output should always be treated as an input to human judgment, not as a final instruction.
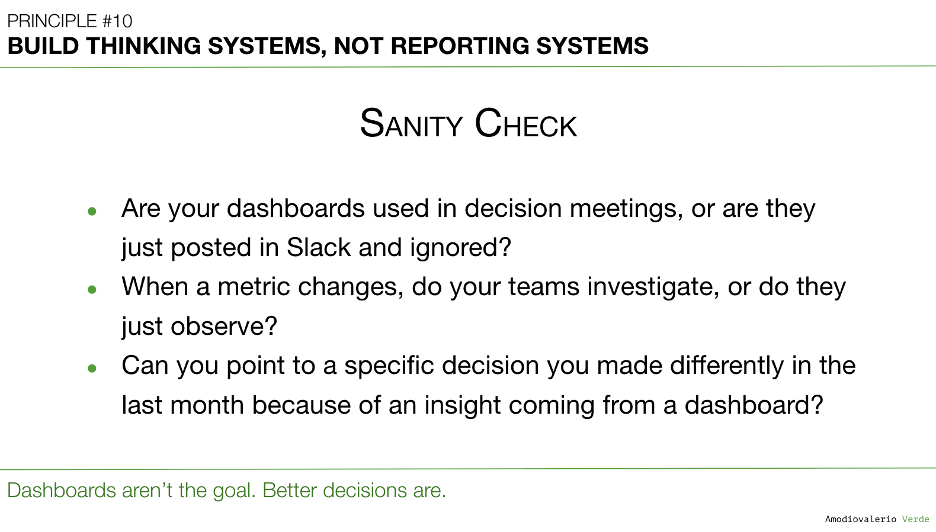
Sanity Check: Is Your Dashboard a Tool or a Trophy?
How do you know if you have a reporting system or a thinking system? Ask these simple questions about your team’s primary dashboard:
- Is this dashboard actively used in decision-making meetings, or is it just posted in a channel and ignored?
- When a key metric changes, do our teams investigate the drivers, or do they just observe the change and move on?
- Can we point to a specific decision we made differently in the last month because of an insight from this dashboard?
If the answers are not crisp, your dashboards are not tools for thinking. They are trophies of a data-driven culture that measures for sport, not for impact.
Final Thought
For years, the goal has been to build beautiful, accurate, real-time dashboards. We’ve succeeded. We have more charts than ever before. But we have confused the means with the end.
The goal was never to have prettier charts; it was to make better decisions.
A reporting system will tell you that you are losing. A thinking system will help you figure out how to win. It reframes the entire purpose of data, from a record of the past to a map for the future. This is the crucial leap that connects all the previous principles, from avoiding delusion to defining our terms. It’s about putting all the pieces together to elevate the one thing AI cannot replicate: human judgment.
What's Next?
We have now journeyed through ten principles designed to build a robust system for clarity and decision-making. We've tackled the delusions, postures, metrics, frameworks, and systems that govern how we interact with data. But all of this work serves a single, ultimate purpose: to sharpen and scale our most valuable asset in an age of automation.
This brings us to the final, capstone principle, where we explore how this entire system comes together to leverage technology not as a replacement, but as a force multiplier for our own intelligence.
Get ready for Principle 11: Turn AI into a Judgment Multiplier.
PAQs – Potentially Asked Questions
Building a "thinking system" sounds complex and time-consuming. How can a fast-moving team start without a massive re-org or tooling overhaul?
You don’t need a new tool; you need a new habit. Start with your next decision-making meeting. Instead of just reviewing the dashboard, frame the conversation around the three core questions of a thinking loop (from Principle 2): 1) What are we trying to learn? 2) What is our hypothesis? and 3) What will we do differently based on the outcome?. Making this your new meeting default costs nothing and immediately shifts the focus from passive reporting to active reasoning.
My organization's leaders just want to see the numbers. How do I introduce the concept of a "thinking system" without sounding like I'm avoiding accountability?
Frame it as a move toward deeper accountability. A reporting system shows if a number is red or green, but it doesn't explain why, nor does it create accountability for the next action. A thinking system does. You can say, "To ensure we're not just reporting on these numbers but actively improving them, we're building a system that connects each KPI to its drivers. This will allow us to move from observing a problem to diagnosing and solving it faster." This frames it as an upgrade in operational rigor, not an escape from it.
What’s the difference between a "thinking system" and a well-designed BI dashboard with drill-down capabilities?
The difference lies in the intent and the workflow. A great BI dashboard is a necessary component of a thinking system, but it is not the system itself. The BI tool provides the "microscope" (Layer 3) we discussed in Principle 7. A thinking system is the complete process that ensures a change in the "telescope" (Layer 1) triggers a structured investigation with the microscope and leads to a decision about which "levers" (Layer 2) to pull. The tool enables the analysis; the system ensures the analysis leads to a decision.
How do you prevent a "thinking system" from creating analysis paralysis, where teams get stuck endlessly debating the "why"?
This is where defining the stakes becomes critical. Before any deep-dive analysis begins, the team must agree on what decision will be made based on the potential outcomes. For example: "We will investigate why user activation has dropped. If we find the cause is the new onboarding flow, we will roll it back. If the cause is a marketing channel change, we will adjust ad spend. If we can't determine the cause in 48 hours, we will escalate." This pre-commitment to action prevents the analysis from becoming an open-ended academic exercise.
Can you give a concrete example of a company that successfully uses a thinking system?
Many mature tech organizations exhibit these principles. When you hear about teams at some large tech orgs having a "disagree and commit" culture or using narrative memos to frame decisions, you're seeing the artifacts of a thinking system. These processes force leaders to articulate their reasoning, assumptions, and expected outcomes before a decision is made. The document isn't the point; the structured thinking it forces is. The goal is to create a culture where decisions are made with explicit, recorded rationale, which is the essence of a thinking system.
Each principle in this series builds upon the last to form a coherent system for better decision-making. Here is the full list of principles we are exploring:
Intro: Beyond the Dashboard Series
Principle 1: Avoid the Data Delusion
Principle 2: Adopt a Data-Informed Approach
Principle 3: Choose What to Measure
Principle 4: Use Frameworks as Filters, Not Blueprints
Principle 5: Focus on Adoption, Not Just Delivery
Principle 6: Know Your Tool Stack’s Boundaries
Principle 7: Build Layered Dashboards to Scale Thinking
Principle 8: Manage Multi-Product Portfolios Separately
Principle 9: Reconcile Metric Definitions Before Analysis
Principle 10: Build Thinking Systems, Not Reporting Systems
Principle 11: Turn AI into a Judgment Multiplier