
Beyond the Dashboard | Principle 6: Know Your Tool Stack’s Boundaries
Your stack holds partial truths. Stop chasing one dashboard. Declare sources of authority, document blind spots, and build smart bridges. AI helps only when boundaries are clear. Orchestrate specialists into a federated system so teams decide faster and argue less. Set escalation for conflicts now.


TL;DR (for the confident scroller)
- Your operational data lives in specialized tools. That’s a reality, not a failure.
- The goal isn’t one dashboard to rule them all. It’s a coordinated system where each tool plays its role.
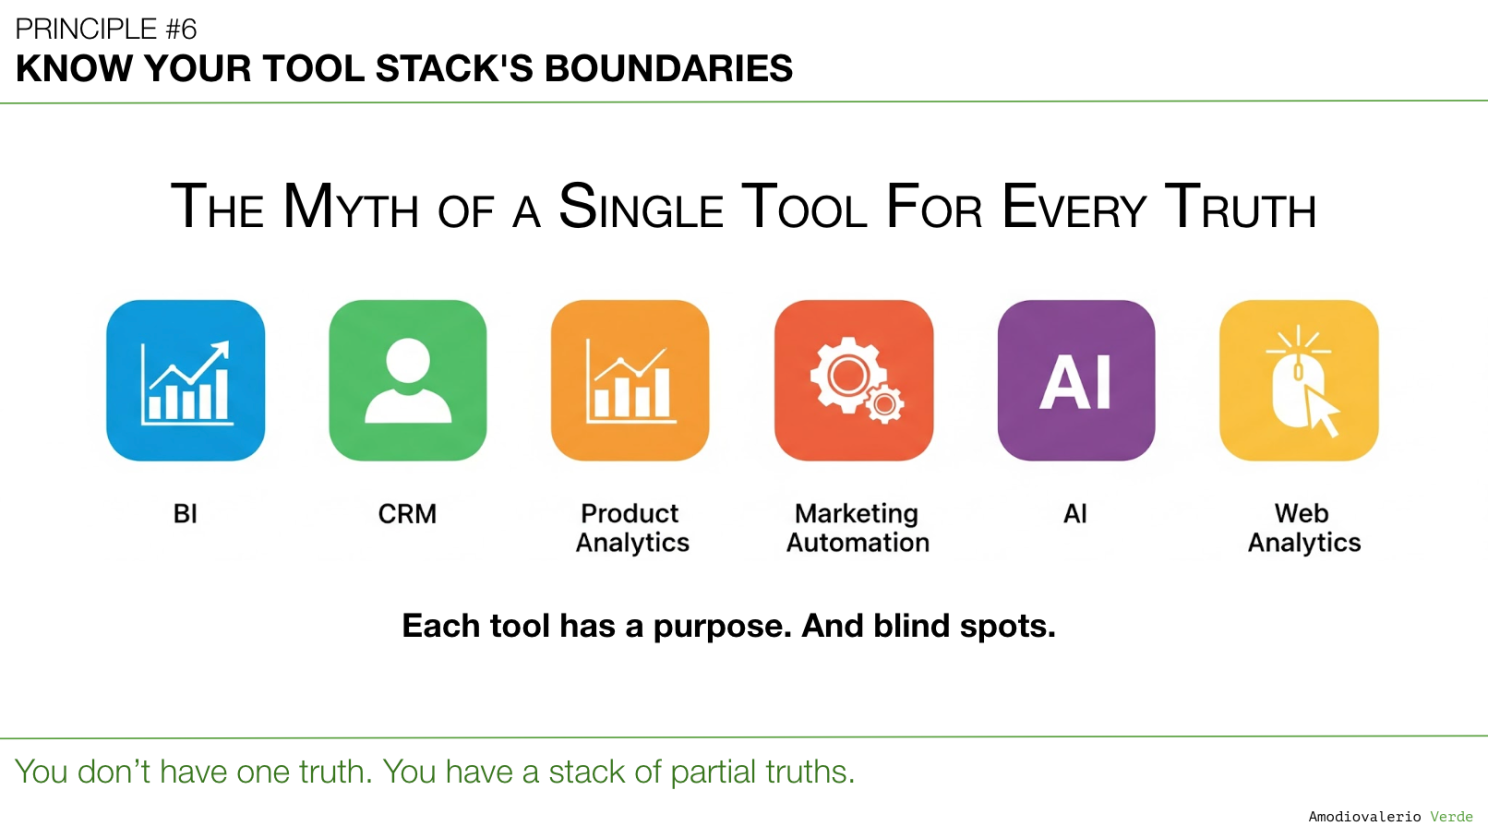
- Every tool has a purpose and blind spots. Your CRM knows the deal, your analytics knows the click, but neither knows the whole story.
- AI can find patterns across tools, but only if you teach it the boundaries of each data source first.
- Stop duct-taping dashboards together. Start building a system of federated clarity.
A Quick Recap: Where We Left Off
In the last article, we explored Principle 5: Focus on Adoption, Not Just Delivery. We reframed shipping as a cost and adoption as the real asset. If shipping is cost, adoption is return.
But the moment you commit to measuring adoption, you hit a wall. Your product analytics say one thing, your CRM says another, and the finance dashboard seems to be from a different company entirely. This brings us to a crucial operational reality: you don’t have one tool for every answer. You have a stack of partial truths.
The Myth of a Single Tool for Every Truth, and the Reality of Your Tool Stack
Let’s be honest about the tool stack used to run a modern product organization. It likely includes:
- A CRM system that tracks customer deals but doesn’t understand product usage.
- A BI tool that’s powerful for financial data but irrelevant to track customer health.
- A product analytics tool with rich behavioral data, but half-instrumented events.
- A sales dashboard built on powerful forecasting models that are necessarily distinct from recognized financial revenue.
- And now… someone just added a shiny new AI layer on top of all of this.
You wanted answers. You got complexity.
Foundational systems like ERPs are critical systems of record, essential for transactional integrity, compliance, and cross-functional governance. They form the stable core around which modern decision systems are built. For transactional data a single source of truth for core business operations is critical.
This article covers the grey zone where multiple specialized tools measure the same metric differently.
The myth isn’t that there should be one source of truth.
The myth is that there’s one truth.
In reality, there are multiple valid perspectives and our job is to orchestrate them. This isn’t an argument against unified platforms. It’s a caution against assuming one system can meet every decision-making need, especially when operational velocity and context vary.
Tools Are Not Oracles. They Are Specialists.
Imagine this scenario:
You ask your CFO, “Why did user activation drop last month?” That question, while important, falls outside the scope of the financial systems they manage. It’s a mismatch of the question to the tool.
Yet we do this with data tools all the time. We expect omniscience from systems designed for narrow use cases.
- Ask your CRM why churn is increasing. It shrugs.
- Ask your product analytics tool to explain sales drop. It plots a graph and disappears.
- Ask AI to “connect the dots”. It obliges… and makes something up.
Your tools are experts, not generalists. The failure isn’t in the tool; it’s in misdirecting the questions.
Data Gaps Are a Feature, Not a Bug
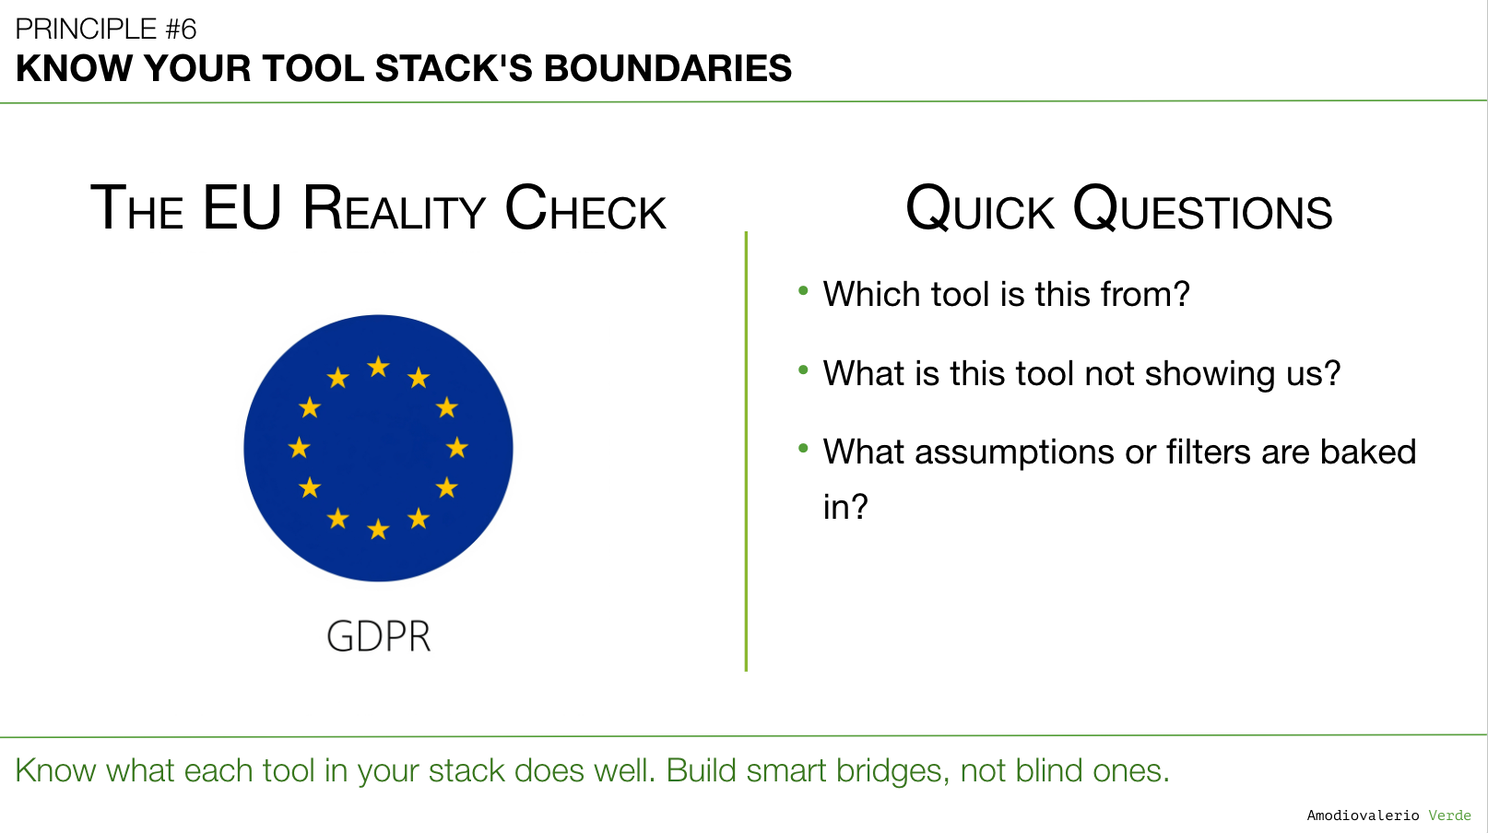
Here’s a fun European reality check: GDPR ensures your data is incomplete by design.
- Users opt out.
- Cookies expire.
- Consent changes.
Every dashboard is an incomplete model of reality, not a perfect photograph of it. This doesn’t mean you can’t make decisions. It means you need to know where your data is blind.
Welcome to modern analytics.
Add in policy constraints, legacy integrations, fragmented ownership, and what you’ve got is a stack of tools, each providing a partial lens.
This doesn’t mean you can’t make decisions. It means you need to know where your data is blind.
Ask These 3 Questions Every Time a Dashboard Appears
Whenever someone presents a number (especially with confidence), pause and ask:
- Which tool is this from? Don’t accept “the dashboard.” Ask which one.
- What is this tool not showing us? Every tool has a blind spot. Name it.
- What assumptions or filters are baked in? Sampling rules, time windows, user cohorts… they all distort.
Asking these questions doesn’t slow decision-making, it prevents hallucination theater.
Why Duct-Tape Dashboards Are Dangerous
You’ve seen this before:
- Someone tries to “merge” BI data with product analytics to create a universal dashboard.
- It looks impressive. Everyone nods.
- But under the surface, the definitions don’t match, filters aren’t aligned, and no one’s quite sure where the numbers came from.
This is not a dashboard. It’s a data cosplay.
Duct-tape dashboards provide a false sense of alignment and worse, they erode trust. Because the moment numbers disagree, people stop deciding and start arguing about whose truth is truer.
These dashboards are merely the visual symptom of a deeper issue: a lack of agreement on metric definitions and authoritative sources.
AI: A Multiplier for Misalignment or Clarity?
AI can summarize insights, generate dashboards, connect tools. Amazing. But if your stack is already inconsistent, AI just multiplies the ambiguity.
- AI models can’t resolve misaligned metric definitions.
- They can’t fix broken instrumentation.
- They can’t distinguish signal from noise if you don’t tell them what the signal is.
This is how you end up with generative analytics confidently summarizing synthetic nonsense. So no, AI doesn’t give you one truth. It gives you more efficient confusion.
Unless…You teach it where your boundaries are.
From a Single Dashboard Answering Everything to a System of Federated Clarity
Let’s shift our goal. Instead of chasing a single, perfect dashboard that merges every tool (which often becomes a high-effort, low-trust data cosplay ), let's aim for federated clarity.
This is a system where we acknowledge and manage our partial truths.
Here’s how to start:
- Declare Sources of Authority: Explicitly define which tool answers which question. For "Net Revenue Retention," the Finance BI Dashboard is the authority. No other tool gets a vote. For "New user adoption of Feature X," the Product Analytics Tool is the authority. Document this in a shared metric dictionary.
- Document Known Blind Spots: For every key tool, document what it cannot see. For instance, "Our product analytics excludes users who opt-out via GDPR" or "Our CRM data doesn't distinguish between active and inactive users on an account." Honesty about data gaps prevents bad assumptions.
- Build Smart Bridges, Not Duct-Tape Dashboards: Instead of forcing misaligned metrics together, build smart bridges by appointing an official "translator." This responsibility is a core charter for a modern Product Operations team, which is chartered with contextualizing insights from different systems and translating them into a coherent narrative for leadership.
This system of Federated Clarity is not built by Product in a silo. It requires a coalition of the willing, with buy-in and partnership from Data, Engineering, Finance, Customer Success, Support and Sales leaders who are all committed to ending the cycle of data debates.
Practical Prompts for Product Teams
Use these with your teams to shift thinking:
- What are the three primary tools we use for decision-making?
- For each: What questions is it good at answering?
- What does each tool miss?
- When numbers conflict, what’s our escalation path?
- Have we ever documented our stack’s constraints? (Spoiler: most teams haven’t).
A Quick Story (Because Metaphors Are Sticky)
Imagine you’re driving to an important meeting across town. You have three navigation systems running:
- Google Maps on your phone shows the standard, reliable route. It says your ETA is 30 minutes, based on historical and live traffic data.
- Waze is also running. Thanks to a user who just reported a fender-bender, it has already rerouted you. It shows an ETA of 28 minutes.
- Your car’s built-in navigation system, which only updates its maps twice a year and doesn't have live traffic, shows a clear path and an ETA of 22 minutes.
Which one is telling the truth?
They all are, based on their specific data model and blind spots. Google Maps has the best traffic model. Waze has the newest event data. Your car’s system has a hopelessly optimistic view, completely unaware of reality.
You, the driver, act as the leader. You don't average the ETAs to get "one single truth." You use your judgment. You trust Waze for the real-time alert, but you glance at Google Maps to confirm the overall traffic pattern, and you completely ignore the car's outdated system.
This is exactly how your data stack works. Your CRM, your BI tool, and your product analytics are all giving you different ETAs for your business. The truth isn’t wrong; it’s just specialized. Your job is to be the driver who knows which map to read for which part of the journey.
Reality Check
Let’s make this personal. When was the last time two of your teams brought conflicting numbers to the same meeting?
What happened next?
- Was a clear decision made, or was another meeting scheduled to “reconcile the data”?
- Did the conversation focus on the strategic choice, or did it devolve into a debate about whose dashboard was more “correct”?
- Did people leave the room with more clarity, or just more frustration and a vague promise to “circle back”?
If those questions make you uncomfortable, it’s because you don’t have a tool problem. You have a systems problem. Your teams are navigating the Tower of Partial Truths without a map.
When AI Can Help
Let’s not throw AI under the bus completely. Used well, it can be a bridge:
- Generate trend summaries across tools, if definitions are aligned.
- Highlight outliers or anomalies quickly, especially useful for debugging.
- Cluster feedback from multiple channels to reveal qualitative gaps in quantitative dashboards.
But only if you define the boundaries and rules. AI is a judgment multiplier not a truth oracle.
Final Thought
Your tools aren’t broken. They’re just context-dependent.
The smarter your questions, the more valuable the stack.
As leaders, our primary role in a data-rich environment is not to find a single tool that tells us the 'truth,' but to orchestrate a system of experts, our tools, and translate their specialized findings into a coherent business strategy.
So stop treating every dashboard like it’s gospel. Start treating your tools like a team of experts, each with a specialty, a limitation, and a perspective.
You already have authoritative truths; you need to respect them and avoid averaging mismatched metrics.
You need to know where each truth ends.
What’s Next?
So far, we’ve talked about what to track, how to track it, and how to interpret the data stack.
But even when you get all that right… your dashboards still fail if they don’t speak the right language to the right audience.
That brings us to Principle 7: Build Layered Dashboards to Scale Thinking.
Because what your analyst needs isn’t what your board needs and trying to please both with the same dashboard is a guaranteed failure.
In the next principle, we’ll explore how to structure dashboards with intentional layers, not to merge misaligned truths, but to present the right perspective to the right audience.
PAQs – Potentially Asked Questions
What’s the best way to handle conflicting numbers across tools?
Start by identifying the source and scope of each number. Then, elevate the conversation. The goal isn't to prove one number "right" and the other "wrong." The goal is to ask: "What decision are we trying to make, and which of these metrics is the best-suited tool for that specific decision?"
Often, the conflict disappears when you understand the context. If Marketing's lead count conflicts with Sales' opportunity count, they aren't conflicting; they are measuring two different stages of a funnel. The leader's job is to stop the debate about the number and refocus the team on the strategic question the number is meant to inform.
How can AI help with messy stacks?
Think of AI as a powerful force multiplier that lacks inherent context, like a brilliant intern, it requires explicit direction to be effective.
It can accelerate pattern recognition, clustering, and summarization at a scale no human can match, but only if the underlying definitions are clear and you give it explicit instructions. Ask it to summarize churn reasons from tickets, and it will do it in minutes.
But if you ask it to "find the relationship" between your messy CRM data and your incomplete product analytics, it will confidently hallucinate a connection for you. Its job is to find patterns, even non-existent ones. Without clear boundaries and clean signals defined by humans, AI, when applied blindly, accelerates confusion. But when paired with clearly defined boundaries, it’s a powerful clarity amplifier.
What’s the role of Product in all this?
Product teams must become the stewards of strategic context. They are uniquely positioned at the intersection of customer behavior (from product analytics), commercial impact (from CRM), and business goals. Their job is to be the primary translator, turning partial truths from different systems into a coherent narrative that informs strategy.
If Product doesn't facilitate this translation, a strategic vacuum is created. While partners in Finance and Ops are the authorities on business and financial data, Product is uniquely positioned to bridge the gap between that data and the underlying user-behavior context. This isn't about ownership; it's about effective partnership.
This "Playbook" audit sounds like a lot of process. How do we do this without slowing down?
Think about how much time is currently wasted in meetings where teams debate the meaning of a chart. That is the real bottleneck. The audit isn't more work; it's a one-time investment to eliminate recurring, low-value work.
A one-hour meeting to declare the "Source of Authority" for NRR saves countless hours of future debate. This isn't about adding bureaucracy; it's about installing a high-leverage operating system for decision-making. It feels slow for a week, then makes you faster for the next year.
Does this apply to a startup, or is this just for big enterprises?
The pain is more acute in an enterprise, but the principle is universal. Every company has a stack. For a startup, it might be Google Analytics, Stripe, and a CRM. The bad habits that create chaos in a 1,000-person company are born when that company has 10 people.
Establishing a simple metric dictionary and declaring sources of authority when you have three tools is easy. Doing it when you have thirty is a painful, year-long political battle. This is one of the few areas where good governance is easier and cheaper to implement when you are small.
Who should own and lead this "Federated Clarity" audit?
This initiative requires a leader who is seen as a neutral arbiter with both strategic context and political capital. While roles like Product Operations or RevOps are strong candidates, modern product leadership is uniquely positioned to drive this.
Product teams are the natural stewards of strategic context. By necessity, they operate at the intersection of customer behavior (from product analytics), commercial impact (from the CRM), and overarching business goals. Their primary job is already to act as a translator, turning these partial truths from different systems into a coherent strategy.
If Product doesn't own this translation, a vacuum is created that other departments may fill, but they often lack the deep customer and usability context. Therefore, leading this audit isn't just an operational task; it's a core competency for modern product leadership. The goal is enterprise-wide clarity, and the VP of Product is often the most natural and effective leader to champion that cause.
How does this approach relate to modern data architectures like a "Data Mesh" or "Data Fabric"?
Data Mesh architectures are built on the principle of decentralized data ownership, where different domains (like Product or Marketing) own their data products.
The framework in this article provides the essential cultural and operational layer for a Data Mesh to actually work. A Data Mesh without clearly declared "Sources of Authority" and documented boundaries is just well-architected chaos. It decentralizes the data but centralizes the confusion. You can think of the "Federated Clarity" playbook as the human-centric operating manual required to make a Data Mesh function as a decision-making system, not just a technical topology.
This principle of federated clarity is the essential human-centric operating manual for modern architectures like the Data Mesh, ensuring that decentralized data ownership doesn't lead to centralized confusion.
Each principle in this series builds upon the last to form a coherent system for better decision-making. Here is the full list of principles we are exploring:
Intro: Beyond the Dashboard Series
Principle 1: Avoid the Data Delusion
Principle 2: Adopt a Data-Informed Approach
Principle 3: Choose What to Measure
Principle 4: Use Frameworks as Filters, Not Blueprints
Principle 5: Focus on Adoption, Not Just Delivery
Principle 6: Know Your Tool Stack’s Boundaries
Principle 7: Build Layered Dashboards to Scale Thinking
Principle 8: Manage Multi-Product Portfolios Separately
Principle 9: Reconcile Metric Definitions Before Analysis
Principle 10: Build Thinking Systems, Not Reporting Systems
Principle 11: Turn AI into a Judgment Multiplier